

GNUplot Curve Fitting
Fitting a polynomial to a set of data in GNUplot is easy to do and easy to verify.
Provided you have your two sets of values. I am trying to see what the effect of temperature is on the output of a transducer. A fairly common thing to want to do.
First collect all your data, then put it in a file like this:
15.0 <tab> 0.003
15.2 <tab> 0.0035
20.0 <tab> 0.002
I will call the file rawdata.tsv.
Or you can put it in a CSV (see later for details on that).
Plot the Raw Data
Plotting the raw data is useful and depending on the amount of noise may be all that is reqired to make the curve. Since all the descrete points recorded in the data are shown the data helps to verify the curve is correct... or determine how wrong it is!
To draw that data in a chart:
plot 'rawdata.tsv'
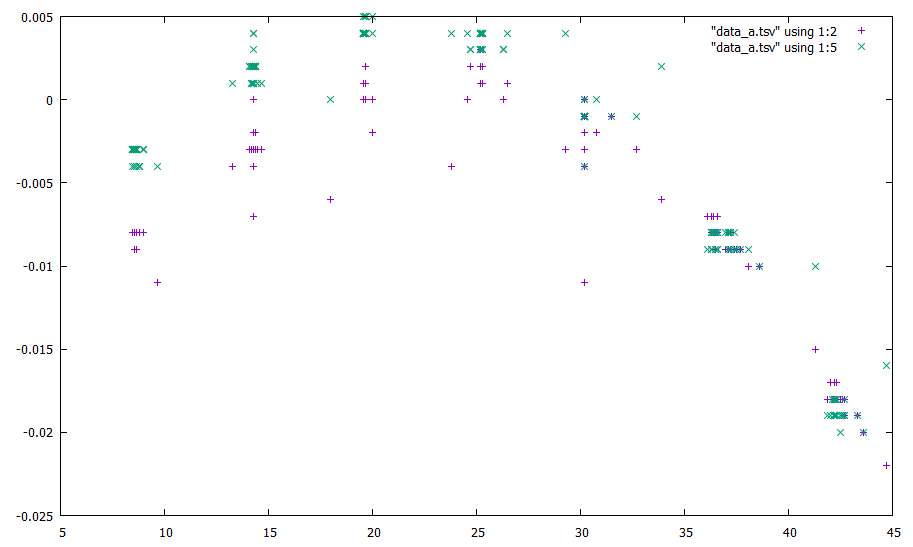
Some sample data is available here which contains several columns of data... this can be rendered in GNUplot like this:
plot 'data_a.tsv' using 1:2, 'data_a.tsv' using 1:4
The numbers 1:2 and 1:4 are column numbers in data_a.tsv
(starting from 1, 0 is the index / row number of the element)
the implied using directive has 1:2 as arguments.
Define the Equation
I am using a 5th order polynomial but you don't have to, GNUplot is able to determine figures for arbitrary equations.
f(x) = a + b*x + c*x**2 + d*x**3 + e*x**4 + f*x**5
Then perform a fit:
fit f(x) 'rawdata.tsv' via f,e,d,c,b,a
Have a look at that curve:
plot 'rawdata.tsv', f(x) lc rgb "red"
That should show you a nice chart with all your datapoints and a
red curve where f(x) goes... and it will be scaled to your data!
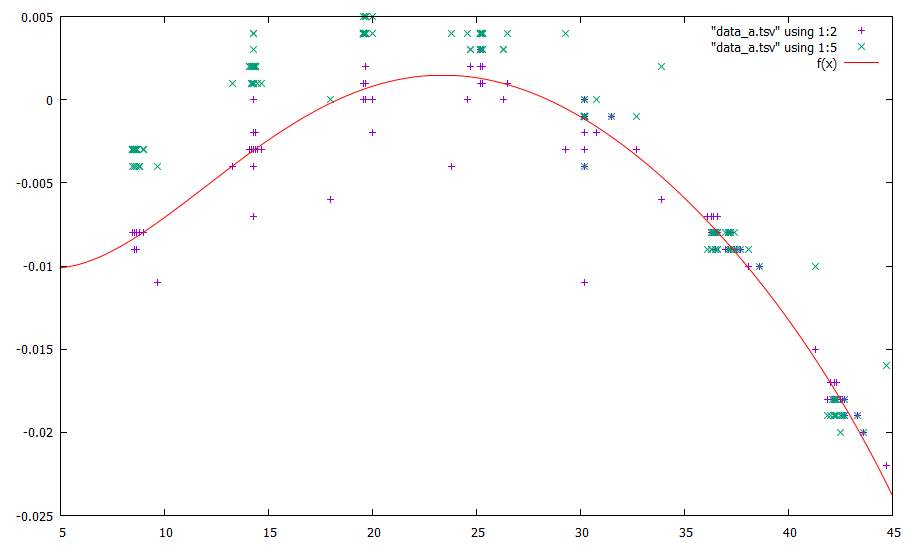
Using the data_a.tsv file from earler, this function was created
by fitting yo the raw data:
fit f(x) "data_a.tsv" using 1:2 via f,e,d,c,b,a
plot "data_a.tsv" using 1:2, "data_a.tsv" using 1:5, f(x) lc rgb "red"
Reading data from a CSV file in GNUplot
set datafile separator ","
plot 'infile.csv' using 0:1
Changing the legend
plot "data_a.tsv" using 1:2 title "My Data"
Reference Material and More Information
- YouTube video to do this
- Official Documentation for Fitting
- 64bit GNUplot for Windows (as used in the video)
- StackOverflow CSV Question